
Technologies
10 March 2026
Biogas analysis, key parameters and examples
In today’s post, we explain in detail the analysis of biogas samples carried out by ATRIA.

The tools for quality management have a high degree of implementation in most industrial companies, but many times only some of them are known or applied. Or sometimes they are not used in the proper way, being considered as little useful. The use of these tools can have a great impact on the efficiency and cost reduction of a company when used in the right way. Throughout this post we are going to tell you about some of the most important tools and how from ATRIA we help to implement them and take advantage of all their usefulness to our clients.
In this blog we will talk about the following tools, which we consider very useful and applicable to practically any company, regardless of the sector in which they are located.
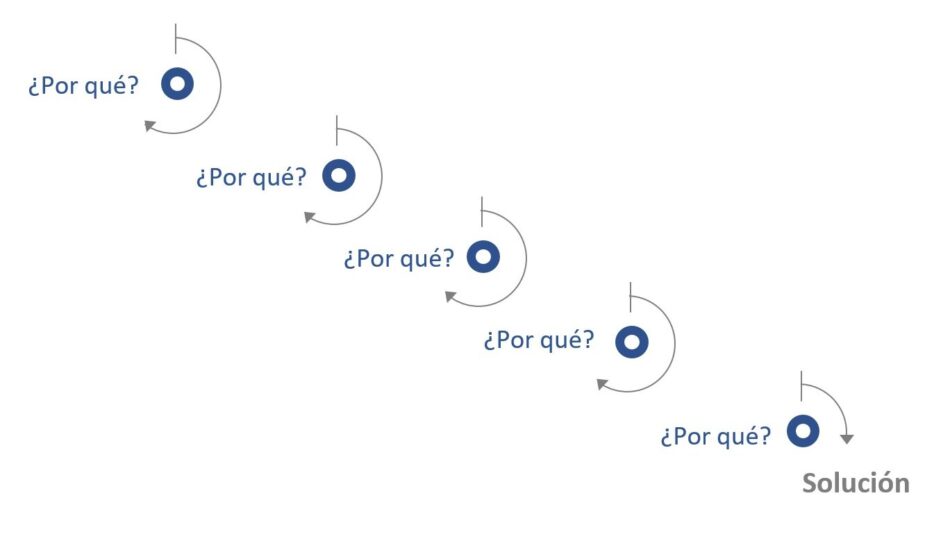
It is a quality technique developed by Sakichi Toyoda and originally used at Toyota. There are many variations of the method based on reducing from 5 to 4, 3 or 2 questions.The method is based on the iteration of questions. The “5” is because it is usually the number of iterations necessary to solve a problem. It is not a rigid method, nor does it provide strict rules, its potential lies in its simplicity. With few resources, very positive results can be achieved.
The goal is to find the root cause of a problem. The pursuit of questions is motivated by the fact that a problem usually has more than one root cause. This method ends when the response is an inefficient or nonexistent process. That is, when a precise answer is obtained from the origin of the problem. If not, the iteration of questions must continue.
On many occasions this process is long, as it cannot be executed completely within the selected team of people. Questions may go unanswered because the answer is ignored. To answer it, communications can be initiated outside the work team, or internally in the company or even with external suppliers. This leads to broadening the team’s knowledge of the problem, increasing the control it has over the process or service. It is a method that allows to focus efforts and find deficiencies or weaknesses in a process.
It is a quality method created by the Japanese anthropologist Kawakita Jiro in the 1960s. It is also called the KJ Method or Team Kawakita Jiro (TKJ).The method starts from the precise definition of a problem. Next, you need to assemble a team of people who have knowledge of the problem or experience with it. Once met, through various means each member proposes ideas that are related to the problem. It is a part very similar to brainstorming, where there is no filter or limitation, the only requirement is that it be related to the problem in the opinion of the participant who proposes the idea. Once all the ideas have been collected, the team proceeds to categorize and order them. Once this is done, the relationships or contradictions that may be found between them will be studied.
The objective is to increase the knowledge that one has about a problem, taking into account many points of view, investigating the possible effects that cause it.
In this type of method, the selection of the participating team is vital, since there may be the risk of choosing a closed group, which contributes the same ideas and does not have the complete vision or perspective of the problem. For this reason, they are usually multidisciplinary teams from various areas of a company.
Designed by Kaoru Ishikawa it is also known as an Ishikawa diagram or fishbone diagram, due to its shape. It is based on graphically representing in a relational way a central trunk, which is a line in the horizontal plane, representing the problem to be analyzed.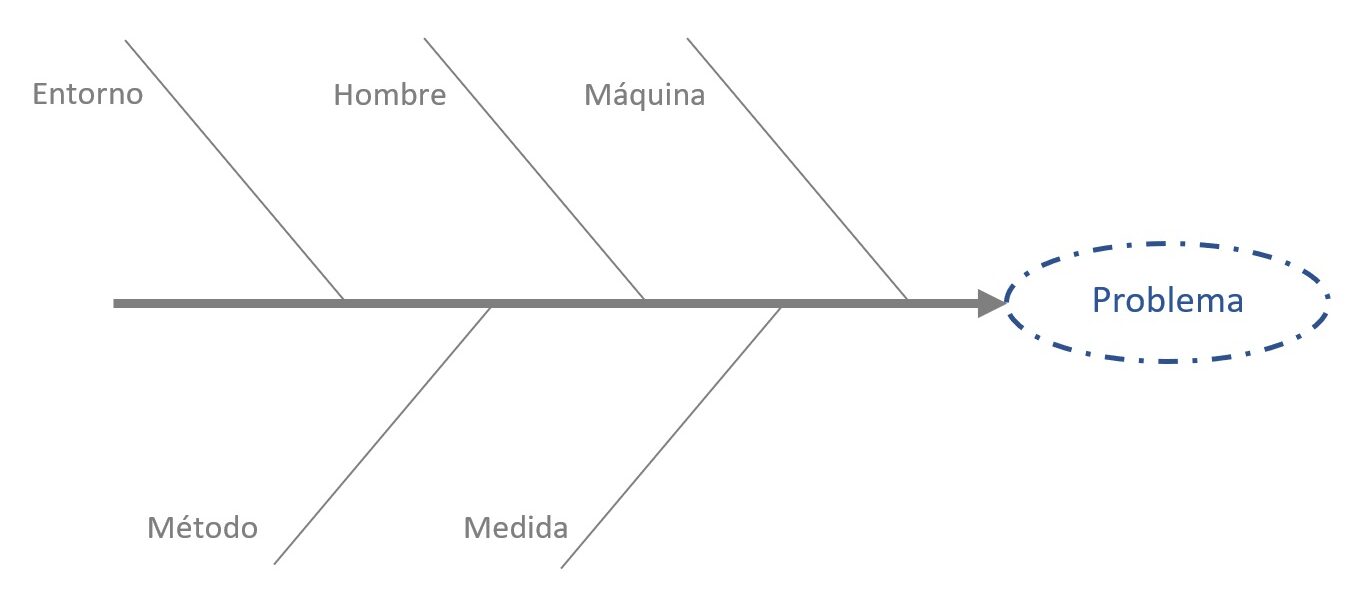 From this central trunk, like thorns, the causes are located, categorized into various blocks. There are variations of this diagram depending on the categories used and their number. The most common are six categories: man, machine environment, material, method, measure. Within these categories are grouped the different ideas that the working group thinks are the causes of the problem. Within the “spines” you can see other secondary spines, which represent secondary causes from the main causes.
Among the quality tools, the cause-effect diagram allows ordering and categorizing the causes of a problem, allowing to focus and organize the actions necessary for its resolution.
It is a diagram focused on the precise characterization of a process or group of processes based on its key elements. These elements are: Suppliers, Inputs, Sub-processes, Outputs and Customers. The name SIPOC is the acronym for these elements in English. Suppliers and customers can be internal or external to the company. The inputs and outputs refer to the product or service offered by the company. The threads are the actions that must be carried out to complete the process under study.
This diagram allows you to have a quick knowledge about a process, its objective is not to detail in excess. In this way you can identify the most important aspects and analyze deficiencies or serious errors in a process. It is also very useful to find blind spots or weaknesses that part of the organization may have regarding the knowledge of a process.
It is the technique par excellence of quality tools. They are the abbreviations of Failure mode and effects analysis (FMEA). FMEA is based on the application of a procedure for classifying potential failures based on their severity, frequency and detection capacity.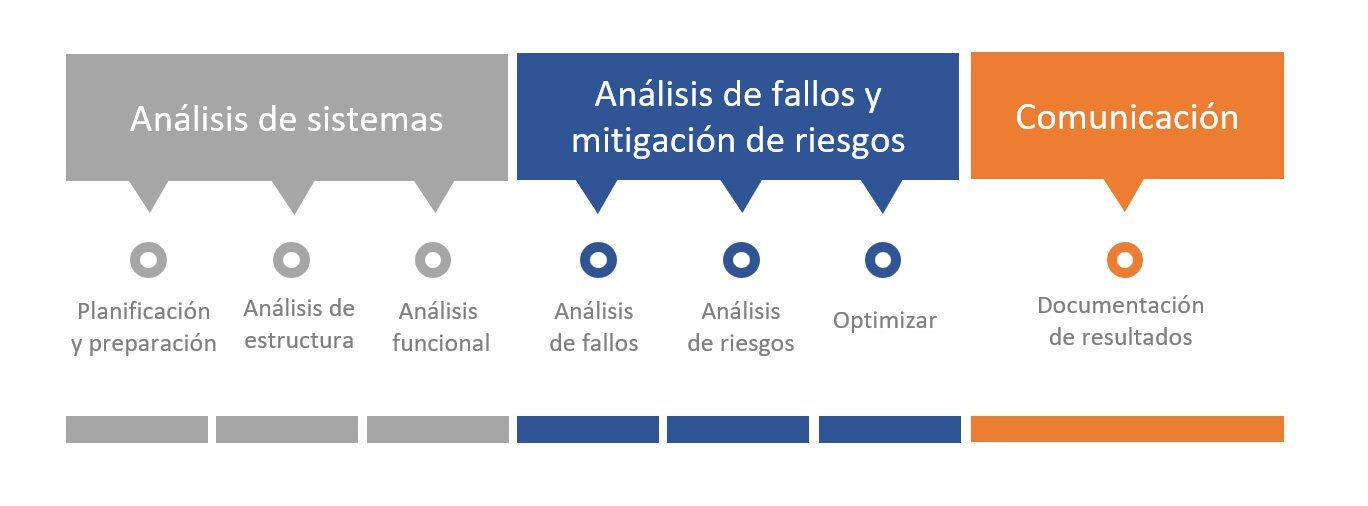 FMEA was introduced by the US military in the late 1940s, but its use became widespread in aerospace development during the Apollo space program. It is a technique widely used in all industrial sectors today and its great usefulness has been widely documented.
The first step in the FMEA technique is to list the failures that can occur in a system or process. This point is key, because if any failure is left out of the list it will never be analyzed. In FMEAs it is vital to form a multidisciplinary group with extensive experience in the process or system to be analyzed. Once the faults have been defined, the effect or effects that these faults have on the system are analyzed. Next, for each effect, its severity level is quantified from 1 to 10. The next step is to identify the causes of the failure and its level of occurrence, quantifying from 1 to 10. Once the causes are identified, the controls that are currently in place are listed and its detection capacity, quantified from 1 to 10. Finally, the coefficients obtained for severity, occurrence and detection capacity are multiplied. The resulting value allows each fault to be classified according to its importance, the ones with the highest value being the first to be solved. Once the FMEAis finished, corrective actions are recommended to reduce the values of the failures detected as most relevant by the FMEA.
The FMEA is a photograph in a specific moment and time. It must be reviewed and updated as the recommended actions are carried out. It is a document of living quality and one that must be updated frequently.
Quality tools can bring great advantages to the production processes of companies. Here are some of the most interesting:
First of all, it is necessary to define the objective pursued by the company, in which process or processes they want to focus.
Once the process is defined, it is necessary to study what type of tools is the one that best suits the process, at the level of knowledge that the organization has about the process and the objectives sought.
Next, we tell you what are the general steps to execute quality tools implementation projects:
Do you want to apply any of these quality tools in your Projects? Contact us!

Your success is our goal. We want to be your partner in the development of your projects, leveraging the power of innovation, flexibility, and the trust we provide. Together, we make a difference through new technologies.
Contact us and let’s build the future together!